Control Engineering I · Week 12 · Damping Ratio and Natural Frequency of a Second-Order System
English translation
Edit the code and response fields in your own copy. Name: ⟦enter here⟧ / Student ID: ⟦enter here⟧
How to run
In Live Editor, click inside the code and run the current section with Run Section (Windows/Linux Ctrl+Enter, Mac ⌘+Enter). Run executes the entire document. Edit the explanations and response fields directly.
Initially run from the top, and rerun any section whose values you change. If an undefined-variable error occurs, run the preceding sections first. Outputs appear below or to the right of the code.
Environment: MATLAB Online and Control System Toolbox.
1. Calculate the performance conditions and design range
Perform the calculations below first, then compare with MATLAB results.
- Change the code’s initial wn value from 4 to the value 5 specified for this activity.For the first run of the “4. Verify the design” code in the practice Live Script, use .
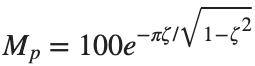
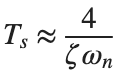
- First calculate the overshoot and settling time by hand using [%] and .
- Use for numerical comparison.
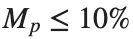
- Determine whether and s are each satisfied. With fixed, express the range of satisfying as an inequality.
- Then change to 5 and run stepinfo to compare the approximation with the measured results.
- Record this condition as one of the existing design combinations.




Before execution — Hand-calculated expressions and values: ⟦write calculations here⟧ After execution — MATLAB output values to compare: ⟦write output values here⟧
2. Convert to standard form
Start with K1=25,K2=4.
Prediction before running: ⟦enter here⟧
K1=25;K2=4;G=tf(K1,[1 K2 0]);T=feedback(G,1);
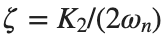
wn=sqrt(K1);zeta=K2/(2*wn);disp([wn,zeta]);
figure;step(T,0:.005:15);title(sprintf('wn=%.2f, zeta=%.2f',wn,zeta));grid on;
disp(stepinfo(T,'SettlingTimeThreshold',.02));
Do it yourself:
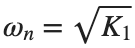
- Calculate natural frequency and damping ratio for the following two combinations: , .
- Record , ζ, and damping type for each combination in one row. Determine damping type from the calculated ζ.



% ✍ Your code: add your own code below.
Changed condition: ⟦enter here⟧
Observed result: ⟦enter here⟧
Differences from the prediction and their causes: ⟦enter here⟧
3. Compare damping ratios
Keep natural frequency fixed.
Prediction before running: ⟦enter here⟧
wn=5;zeta_list=[.1 .3 .7 1.2];
figure;hold on;
for zeta=zeta_list
T=tf(wn^2,[1 2*zeta*wn wn^2]);[y,t]=step(T,0:.005:20);plot(t,y,'DisplayName',sprintf('zeta=%.1f',zeta));
info=stepinfo(T);disp([zeta info.Overshoot info.SettlingTime]);
end
legend;grid on;
Do it yourself:
- At the same ζ, double only and find stepinfo for the models before and after the change.
- Record ζ, , overshoot, rise time, and settling time in two rows for before and after the change.
- Check whether overshoot stays nearly the same and both time metrics become about half their original values. State which metrics natural frequency primarily changes when damping ratio is fixed.


% ✍ Your code: add your own code below.
Changed condition: ⟦enter here⟧
Observed result: ⟦enter here⟧
Differences from the prediction and their causes: ⟦enter here⟧
4. Verify the design
Use the approximation for an initial choice, then check the actual metrics.
Prediction before running: ⟦enter here⟧
zeta=.7;wn=4;T=tf(wn^2,[1 2*zeta*wn wn^2]);
info=stepinfo(T,'SettlingTimeThreshold',.02);
passes=info.SettlingTime<=2 && info.Overshoot<=10;disp(info);disp(passes);
Do it yourself:
- Besides the baseline combination, choose two combinations of ζ and to satisfy the existing requirements: overshoot and settling time s.
- Read overshoot and settling time from each model's stepinfo and state separately whether each condition is satisfied. Compare with the model metrics rather than deciding from the calculated approximation alone.
- Also record one combination that fails the conditions. Use columns for ζ, , overshoot, settling time, and whether each condition is satisfied; mark the failed metric.


% ✍ Your code: add your own code below.
Changed condition: ⟦enter here⟧
Observed result: ⟦enter here⟧
Differences from the prediction and their causes: ⟦enter here⟧
Practice through repetition and check before submission
Summarize the three conditions compared in the preceding hands-on activities below. You do not need to repeat experiments already completed. Predictions may state increasing or decreasing trends instead of exact values.
Repetition 1 — Condition: ⟦enter here⟧ / Prediction: ⟦enter here⟧ / Actual result: ⟦enter here⟧
Trial 2 — Condition: ⟦enter here⟧ / Prediction: ⟦enter here⟧ / Observation: ⟦enter here⟧
Trial 3 — Condition: ⟦enter here⟧ / Prediction: ⟦enter here⟧ / Observation: ⟦enter here⟧
Optional:
Example: omitting natural frequency from a second-order denominator
- Keep zeta=.7 and wn=4, and create a separate model by changing the denominator from [1 2*zeta*wn wn^2] to [1 2*zeta wn^2].
- Record both models' poles and the settling time and overshoot of stepinfo side by side. Change only the second denominator coefficient to 2*zeta*wn and recalculate.
Include code, actual outputs and plots, and your own interpretation. Submit through KLAS; check the semester schedule and latest announcements for the deadline.
Filename: Name_StudentID_Week12.mlx.