
Frequency-Domain Stability · Lesson
English translation
Execution conditions
MATLAB · Control System Toolbox
Topics covered
Before simulating all time responses, try assessing stability from the frequency response and open-loop poles.
Overall workflow
Open-loop poles → Nyquist plot → stability margins → check closed-loop poles
Nyquist and open-loop poles
Counting only encirclements of −1 can lead to an incorrect stability assessment. Use both the number of open-loop right-half-plane poles and the sign of the encirclement direction, and check against directly calculated closed-loop poles.
Conditions for interpreting stability margins
The gain crossover frequency is where the open-loop response magnitude is 1. The difference between the phase at this frequency and −180° is the phase margin.
At a frequency where phase is −180°, the reciprocal of the response magnitude is the gain margin. Mark crossover points on the Bode plot to show where both margins are calculated.
Checking frequency response and closed-loop poles
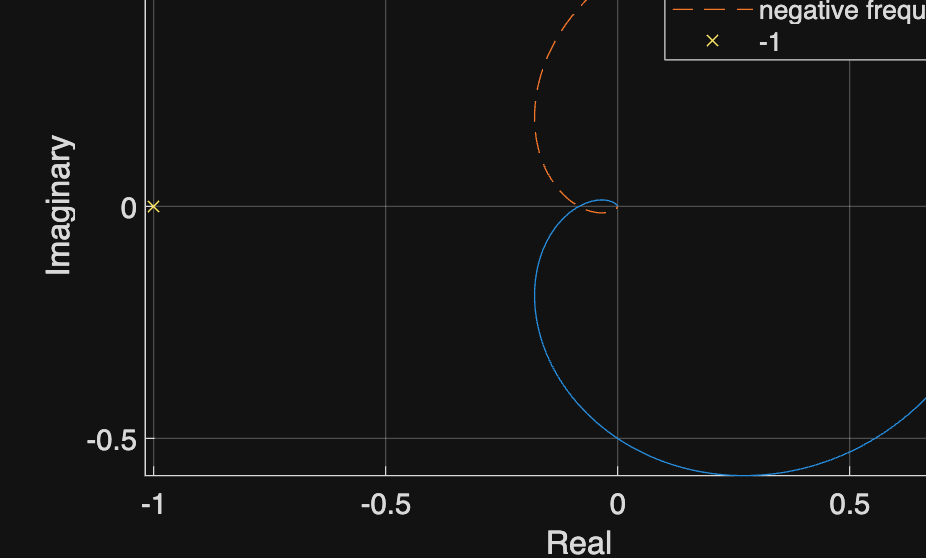
Examine the Nyquist plot and closed-loop poles of L(s)=5/((s+1)(s+2)(s+3)). This example has no open-loop right-half-plane poles.
%% Worked example
s=tf('s'); L=5/((s+1)*(s+2)*(s+3)); omega=logspace(-3,3,1000);
z=squeeze(freqresp(L,omega)); figure;
plot(real(z),imag(z),real(z),-imag(z),'--'); hold on; plot(-1,0,'x');
xlabel('Real'); ylabel('Imaginary'); axis equal; grid on
legend('positive frequency','negative frequency','-1'); disp(pole(feedback(L,1)));
Reference example
View more examples