Model Uncertainty and Robustness · Lesson
English translation
Execution conditions
MATLAB · Control System Toolbox
Topics covered
Apply a controller designed for one model to several actual models and delay conditions to find where performance deteriorates.
Nominal and actual models
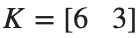
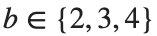
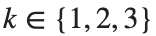
The plant is , with state-feedback gain fixed at . Using all combinations of mass , damping , and stiffness gives models to check.



Examining stability and performance separately
Assess stability from each model's poles, and compare steady-state error and settling time in the step responses. The performance table for the 27 combinations reports results at the selected values.
Before applying input delay and saturation, stability of the linear model can be assessed using the characteristic polynomial . If all three coefficients of a 2nd-order polynomial are positive, its poles have negative real parts. All three coefficients are positive throughout the given range, so the system is stable throughout that range.


Response speed and error depend on the parameters.
Checking the same design in MATLAB
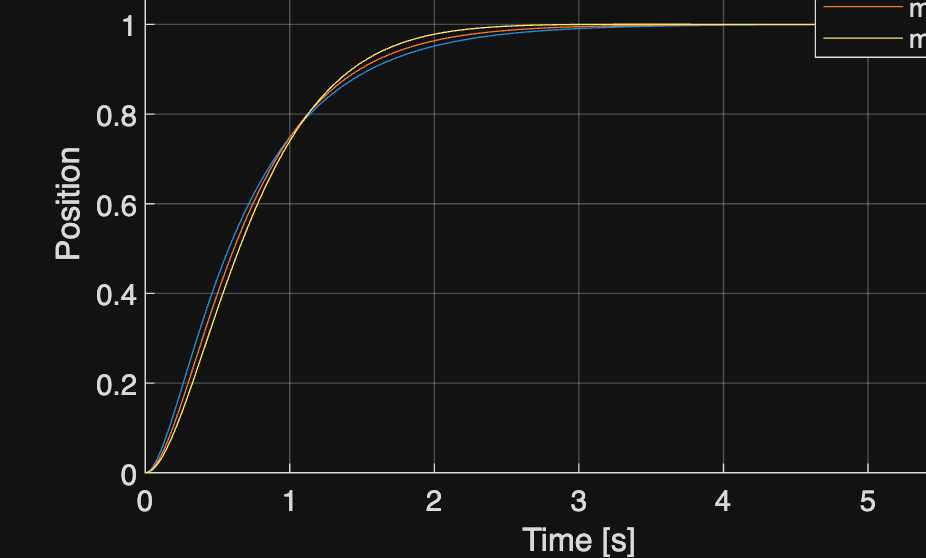
Keep the designed gain fixed and change only the plant's mass, damping, and stiffness. The poles of each combination indicate stability; the response curves show changes in overshoot and settling time.
Actual systems with different masses
Keep the same controller and change only mass to compare poles and time responses.
%% Worked example
A0=[0 1;-2 -3]; B0=[0;1]; C=[1 0]; K=place(A0,B0,[-2 -4]); N=8;
t=linspace(0,6,1201)'; figure; hold on
for m=[.7 1 1.3]
A=[0 1;-2/m -3/m]; B=[0;1/m]; p=eig(A-B*K);
y=lsim(ss(A-B*K,B*N,C,0),ones(size(t)),t);
fprintf('mass %.2f\n',m); disp(p); plot(t,y,'DisplayName',sprintf('m=%g',m));
end
xlabel('Time [s]'); ylabel('Position'); legend; grid on