
Model Uncertainty and Robustness
English translation
Execution conditions
MATLAB · Control System Toolbox
Learning objectives
Apply a controller designed for one model to several actual models and delay conditions to find where performance deteriorates.
Applying the nominal controller to other actual models
Starting conditions
kg, N·s/m, N/m. Fix K and N at the values designed for .



Procedure
- Keep the nominal controller fixed and compare the poles and responses of the three actual models.
- Find the final value and 2% settling time of each response, and identify the slowest condition.
Results to retain
- Three response curves and a comparison table of poles and settling times.
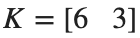
A0=[0 1;-2 -3]; B0=[0;1]; C=[1 0]; K=place(A0,B0,[-2 -4]); N=8;
t=linspace(0,6,1201)'; figure; hold on
for m=[.7 1 1.3]
A=[0 1;-2/m -3/m]; B=[0;1/m]; p=eig(A-B*K);
y=lsim(ss(A-B*K,B*N,C,0),ones(size(t)),t);
fprintf('mass %.2f\n',m); disp(p); plot(t,y,'DisplayName',sprintf('m=%g',m));
end
xlabel('Time [s]'); ylabel('Position'); legend; grid on
Record results and self-check
Mass | |
Pole | |
Final value | |
Settling Time |
Points to check
- Did you keep K unchanged rather than redesigning it for each actual model?
- Did you check that the response stays within the 2% band after the settling time?
Changing mass, friction, and stiffness together
Starting conditions
Use the 27 combinations of m∈{.7,1,1.3}, b∈{2,3,4}, and k∈{1,2,3}. Keep and fixed.

Procedure
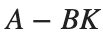
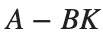
- For each combination, find the maximum real part of the eigenvalues of . Record the number of models where this value is negative and where it is 0 or greater.
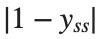
- Find the combination with the largest maximum real part. Also calculate for each combination, and separately find the combination with the largest .
- For the two selected combinations, tabulate , maximum pole real part, and steady-state error, and plot unit-step responses on the same time axis.
- Distinguish the parameter values checked in this calculation from the unchecked values between them. Explain which coefficient conditions in the learning material's characteristic polynomial should be examined to assess stability over the entire range.


Results to retain
- A stability summary for the 27 conditions and responses for the two extreme cases.
records=[];
for m=[.7 1 1.3]
for b=[2 3 4]
for k=[1 2 3]
A=[0 1;-k/m -b/m]; B=[0;1/m]; aa=A-B*K;
maxReal=max(real(eig(aa))); final=-C*(aa\(B*N)); records(end+1,:)=[m b k maxReal abs(1-final)];
end
end
end
[~,near]=max(records(:,4)); [~,large]=max(records(:,5)); disp(records(near,:)); disp(records(large,:));
% TODO: Add the unit-step responses of these two models on the same time axis.
Record results and self-check
m,b,k | |
Maximum pole real part | |
Steady-State Error |
Points to check
- Did you calculate poles from rather than A?
- Did you distinguish pole calculations for the 27 combinations from analytical justification covering the entire parameter range?
With input delay and saturation
Starting conditions
Euler-integrate the nominal model's state with dt=.002 s steps for 6 s. Input delays are 0,.08,.2 s, and the input limit is ±4.
Procedure
- Use the practice notebook's function to plot outputs and inputs for the three delays.
- Halve dt and check that the main responses remain similar.
- Explain why linear-pole stability alone is insufficient to assess an implementation with delay and saturation.
Results to retain
- Output and input curves, RMS tracking error (after 2 s), input saturation fraction (the full 0–6 s record), and comparison of integration time steps.
figure; hold on
for delay=[0 .08 .2]
[tt,yy,uu]=delayedInput(delay,.002,A0,B0,K,N); keep=tt>=2;
disp([delay sqrt(mean((1-yy(keep)).^2)) mean(abs(uu)>=4-1e-8)]);
plot(tt,yy,'DisplayName',sprintf('delay=%g',delay));
end
xlabel('Time [s]'); ylabel('Position'); legend; grid on
% TODO: Compare the input plots and dt=.001 results.
function [times,ys,us]=delayedInput(delay,dt,A0,B0,K,N)
times=(0:dt:6)'; x=zeros(2,1); commands=zeros(size(times)); ys=zeros(size(times)); us=zeros(size(times)); lag=round(delay/dt);
for n=1:numel(times)
command=min(max(N-K*x,-4),4); commands(n)=command;
if n>lag, u=commands(n-lag); else, u=0; end
ys(n)=x(1); us(n)=u; x=x+dt*(A0*x+B0*u);
end
end
Record results and self-check
Delay | |
dt | |
RMS tracking error | |
Input saturation fraction |
Points to check
- Is delay implemented by retrieving past inputs from the command history?
- Did you avoid confusing time-step effects with model instability?