
Control Engineering I · Week 09 · Closed-loop Gain and Sensitivity
English translation
Edit the code and response fields in your own copy. Name: ⟦enter here⟧ / Student ID: ⟦enter here⟧
How to run
In Live Editor, click inside the code and run the current section with Run Section (Windows/Linux Ctrl+Enter, Mac ⌘+Enter). Run executes the entire document. Edit the explanations and response fields directly.
Initially run from the top, and rerun any section whose values you change. If an undefined-variable error occurs, run the preceding sections first. Outputs appear below or to the right of the code.
Environment: MATLAB Online and Control System Toolbox.
1. Calculate closed-loop gain and sensitivity
Perform the calculations below first, then compare with MATLAB results.
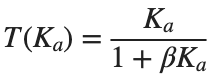
- Before running the “3. Verify relative changes” code in the practice Live Script, calculate by hand using .
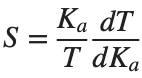
- Differentiate and substitute into to obtain the baseline sensitivity .
- Approximate calculation: multiply by the relative increase 0.1 in .
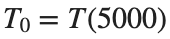
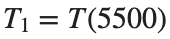
- Exact calculation: Find and separately, then calculate .
- You may leave both answers as fractions.
- Save both handwritten calculations, then run the “3. Verify relative changes” code in the practice Live Script and compare them with approx·exact.
- If they differ, check whether the denominator uses the pre-change .
- Then repeat for the 1% and 20% conditions.
- You have already completed the 10% condition, so you do not need to repeat it.





Before execution — Hand-calculated expressions and values: ⟦write calculations here⟧ After execution — MATLAB output values to compare: ⟦write output values here⟧
2. Baseline gain and sensitivity
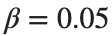
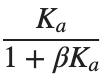
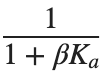
Sensitivity is the ratio of relative changes for a very small gain change. For a finite change such as +10%, the predicted change may differ slightly from recalculating the original function. Differentiating the overall gain T=Ka/(1+beta*Ka) gives dT/dKa=1/(1+beta*Ka)^2. Substituting into S=(Ka/T)*(dT/dKa) gives S=1/(1+beta*Ka). For a small change, ΔT≈(dT/dKa)ΔKa, hence ΔT/T≈S*(ΔKa/Ka). Below, approx uses this expression, while exact directly compares T before and after the change.
Prediction before running: ⟦enter here⟧
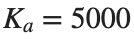
Ka=5000;beta=.05;
Topen=Ka;Tclosed=Ka/(1+Ka*beta);
Sopen=1;Sclosed=1/(1+Ka*beta);
disp(table(Topen,Tclosed,Sopen,Sclosed));
Do it yourself:
Keep and apply . Substitute each into the open-loop gain , closed-loop gain , and sensitivity , and tabulate the three gain conditions as rows.



% ✍ Your code: add your own code below.
Changed condition: ⟦enter here⟧
Observed result: ⟦enter here⟧
Differences from the prediction and their causes: ⟦enter here⟧
3. Verify relative changes
The relative change is (gain after change−gain before change)/gain before change. Check that you are not dividing by the changed gain.
Prediction before running: ⟦enter here⟧
Ka=5000;beta=.05;delta=.1;
T0=Ka/(1+Ka*beta);T1=(Ka*(1+delta))/(1+Ka*(1+delta)*beta);
exact=(T1-T0)/T0;approx=delta/(1+Ka*beta);
disp(table(exact,approx));
Do it yourself:
- Calculate exact and approx in the relative-change calculation code for . Keep and unchanged.
- Record δ, the exact relative change, the approximate relative change, and their absolute difference in one table.
- Use the last table column to determine whether approximation error increases as δ increases. Also compare the relative gain change without feedback δ with the closed-loop value exact, and explain how much the change is reduced.

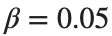
% ✍ Your code: add your own code below.
Changed condition: ⟦enter here⟧
Observed result: ⟦enter here⟧
Differences from the prediction and their causes: ⟦enter here⟧
4. Repeat the checks
Change Ka successively, calculate using the same sensitivity equation, and plot the curves. Check how sensitivity changes as Ka increases.
Prediction before running: ⟦enter here⟧
beta=.05;Ka=logspace(1,5,100);S=1./(1+Ka*beta);
figure;semilogx(Ka,S);xlabel('Amplifier gain Ka');ylabel('Sensitivity');grid on;
Do it yourself:
- Add and to in the sensitivity plotting code. Plot three sensitivity curves on the same Ka vector and show β in the legend.
- At the same , record the closed-loop gain and sensitivity for each β side by side. For example, compare the three cases at the baseline .
- Explain closed-loop gain in terms of output magnitude, and sensitivity in terms of the relative gain change caused by changes in . Distinguish a small gain from insensitivity to change.


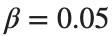

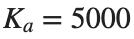

% ✍ Your code: add your own code below.
Changed condition: ⟦enter here⟧
Observed result: ⟦enter here⟧
Differences from the prediction and their causes: ⟦enter here⟧
Practice through repetition and check before submission
Summarize the three conditions compared in the preceding hands-on activities below. You do not need to repeat experiments already completed. Predictions may state increasing or decreasing trends instead of exact values.
Repetition 1 — Condition: ⟦enter here⟧ / Prediction: ⟦enter here⟧ / Actual result: ⟦enter here⟧
Trial 2 — Condition: ⟦enter here⟧ / Prediction: ⟦enter here⟧ / Observation: ⟦enter here⟧
Trial 3 — Condition: ⟦enter here⟧ / Prediction: ⟦enter here⟧ / Observation: ⟦enter here⟧
Optional:
Example: using matrix division instead of element-wise division
- In a copy of the “4. Repeat the checks” code in the practice Live Script, replace S=1./(1+Ka*beta) with S=1/(1+Ka*beta). Record whether a vector Ka causes an error or yields dimensions different from those expected.
- Change only this line to ./ and write size(Ka) and size(S). Check whether the two vectors' elements correspond one to one.
Include code, actual outputs and plots, and your own interpretation. Submit through KLAS; check the semester schedule and latest announcements for the deadline.
Filename: Name_StudentID_Week9.mlx.